More Choice, Longer Timelines, and Greater Negotiating Power
Commercial real estate across rural Eastern Ontario is moving slowly, giving buyers more selection and negotiating leverage while requiring sellers to be increasingly precise about pricing, property presentation, and positioning. A review of activity across Leeds and Grenville, Lanark, Frontenac, and Stormont-Dundas-Glengarry shows 112 active commercial listings compared with only 27 completed sales over approximately the past six months.
This analysis includes the commercial property types tracked throughout the region: retail, farm, industrial, investment, vacant commercial land, office, sale of business, and mixed-use store-with-apartment properties. Although these property types serve different buyers and require different valuation methods, looking at them together provides an important measure of overall liquidity within the rural commercial market.
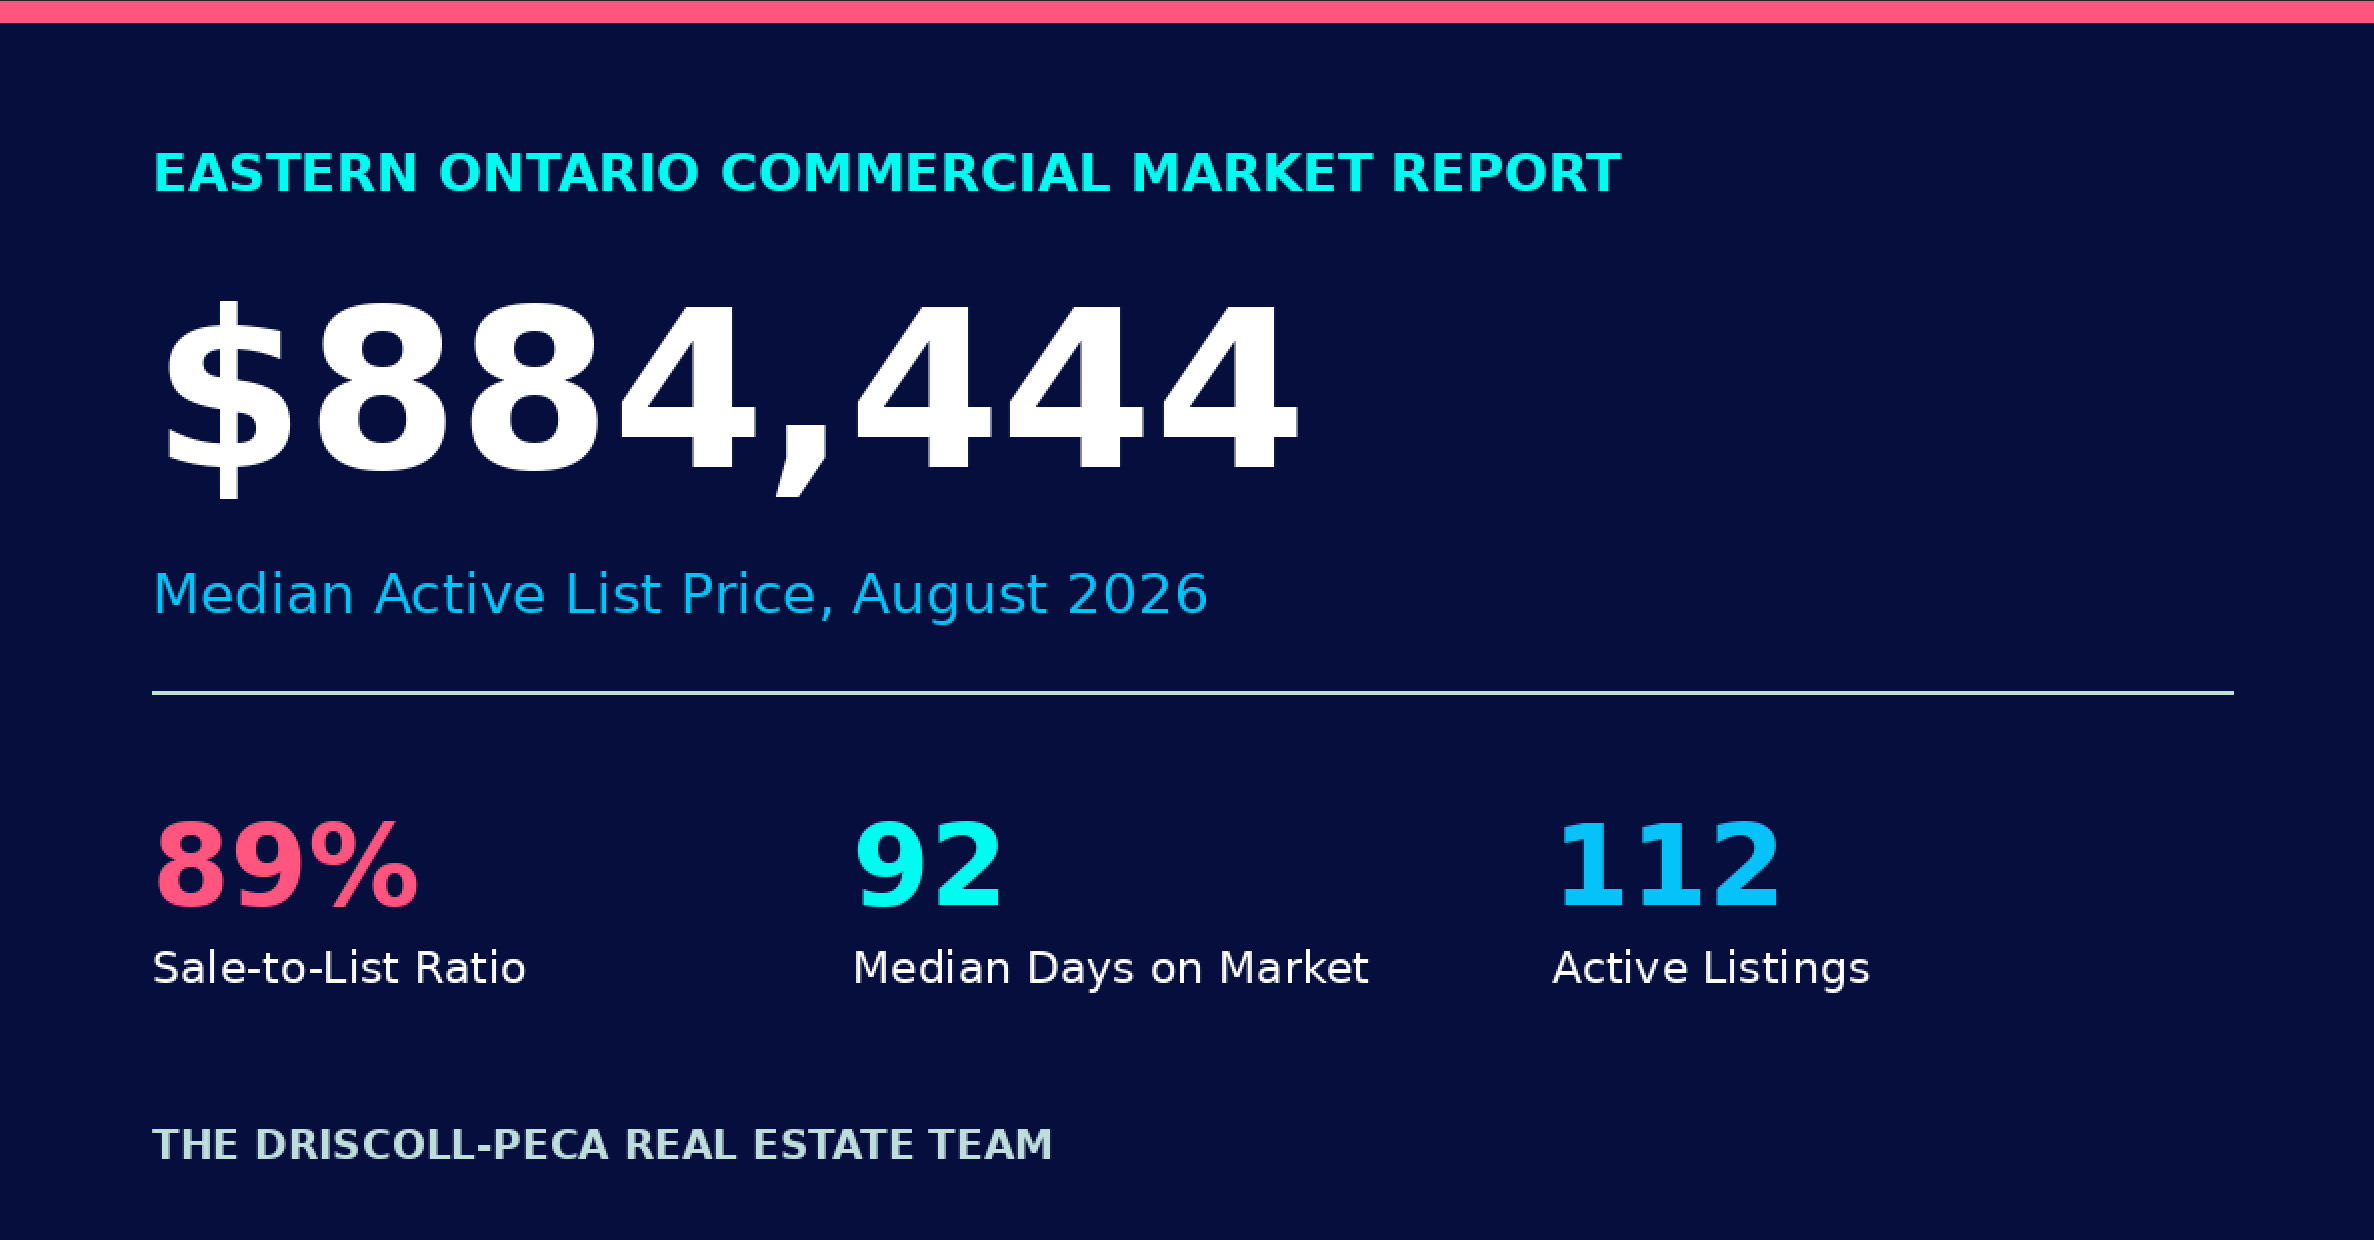
Quick Answer: Rural Eastern Ontario's commercial market currently has about 25 months of inventory. Active listings carry a median price of $884,444, while recent sales closed at a median of $580,000, roughly 89% of asking price, after a median of 105 days on market.



Commercial Market at a Glance
| Market Indicator | Current Result | What It Suggests |
|---|---|---|
| Active listings | 112 | Buyers have substantial selection |
| Sales in approximately six months | 27 | Transaction volume remains limited |
| Estimated monthly sales pace | 4.5 sales/month | Inventory is being absorbed slowly |
| Estimated months of inventory | ~25 months | Conditions are weighted toward buyers |
| Median active list price | $884,444 | Current seller expectations remain elevated |
| Median sold price | $580,000 | Completed transactions occur at lower price points |
| Median sale-to-list ratio | 89% | Negotiation is a normal part of recent transactions |
| Median days on market (sold) | 105 days | Sellers should plan for a multi-month marketing period |
A Market Weighted Toward Buyers
The clearest measure of current market conditions is the relationship between supply and completed sales. The region has more than four active listings for every property sold during the six-month study period. Viewed as a monthly absorption rate, the 27 sales represent approximately 4.5 completed transactions per month.
At that pace, the 112 active listings represent close to 25 months of inventory, assuming no additional properties enter the market and the sales rate remains consistent. New listings will continue to be introduced, but this calculation illustrates the depth of current supply relative to buyer demand. A market with nearly two years of inventory gives qualified buyers time to compare opportunities, complete due diligence, and negotiate terms without the urgency associated with a supply-constrained market.
For sellers, this does not mean commercial property cannot sell. It means buyers can afford to be selective. A property must compete not only on price but also on permitted use, condition, income potential, location, financing feasibility, environmental considerations, servicing, access, and the clarity of the information available to buyers.
Why Rural Commercial Real Estate Moves Differently
Commercial activity in rural Eastern Ontario operates differently from the residential market. The potential buyer pool is smaller, financing can be more specialized, and each property may appeal to a relatively narrow group of businesses or investors. A building suited to automotive use, food service, agricultural processing, professional offices, or mixed residential-commercial occupancy may not be easily adapted to another purpose without additional approvals or capital investment.
Rural properties can involve due diligence less common in urban commercial transactions, including zoning and legal non-conforming uses, private wells and septic systems, road access, loading capacity, hydro service, environmental history, conservation authority restrictions, development charges, and the availability of high-speed internet. Each unresolved issue can extend the decision-making period or affect the price a buyer is prepared to pay.
What the Sold Data Shows
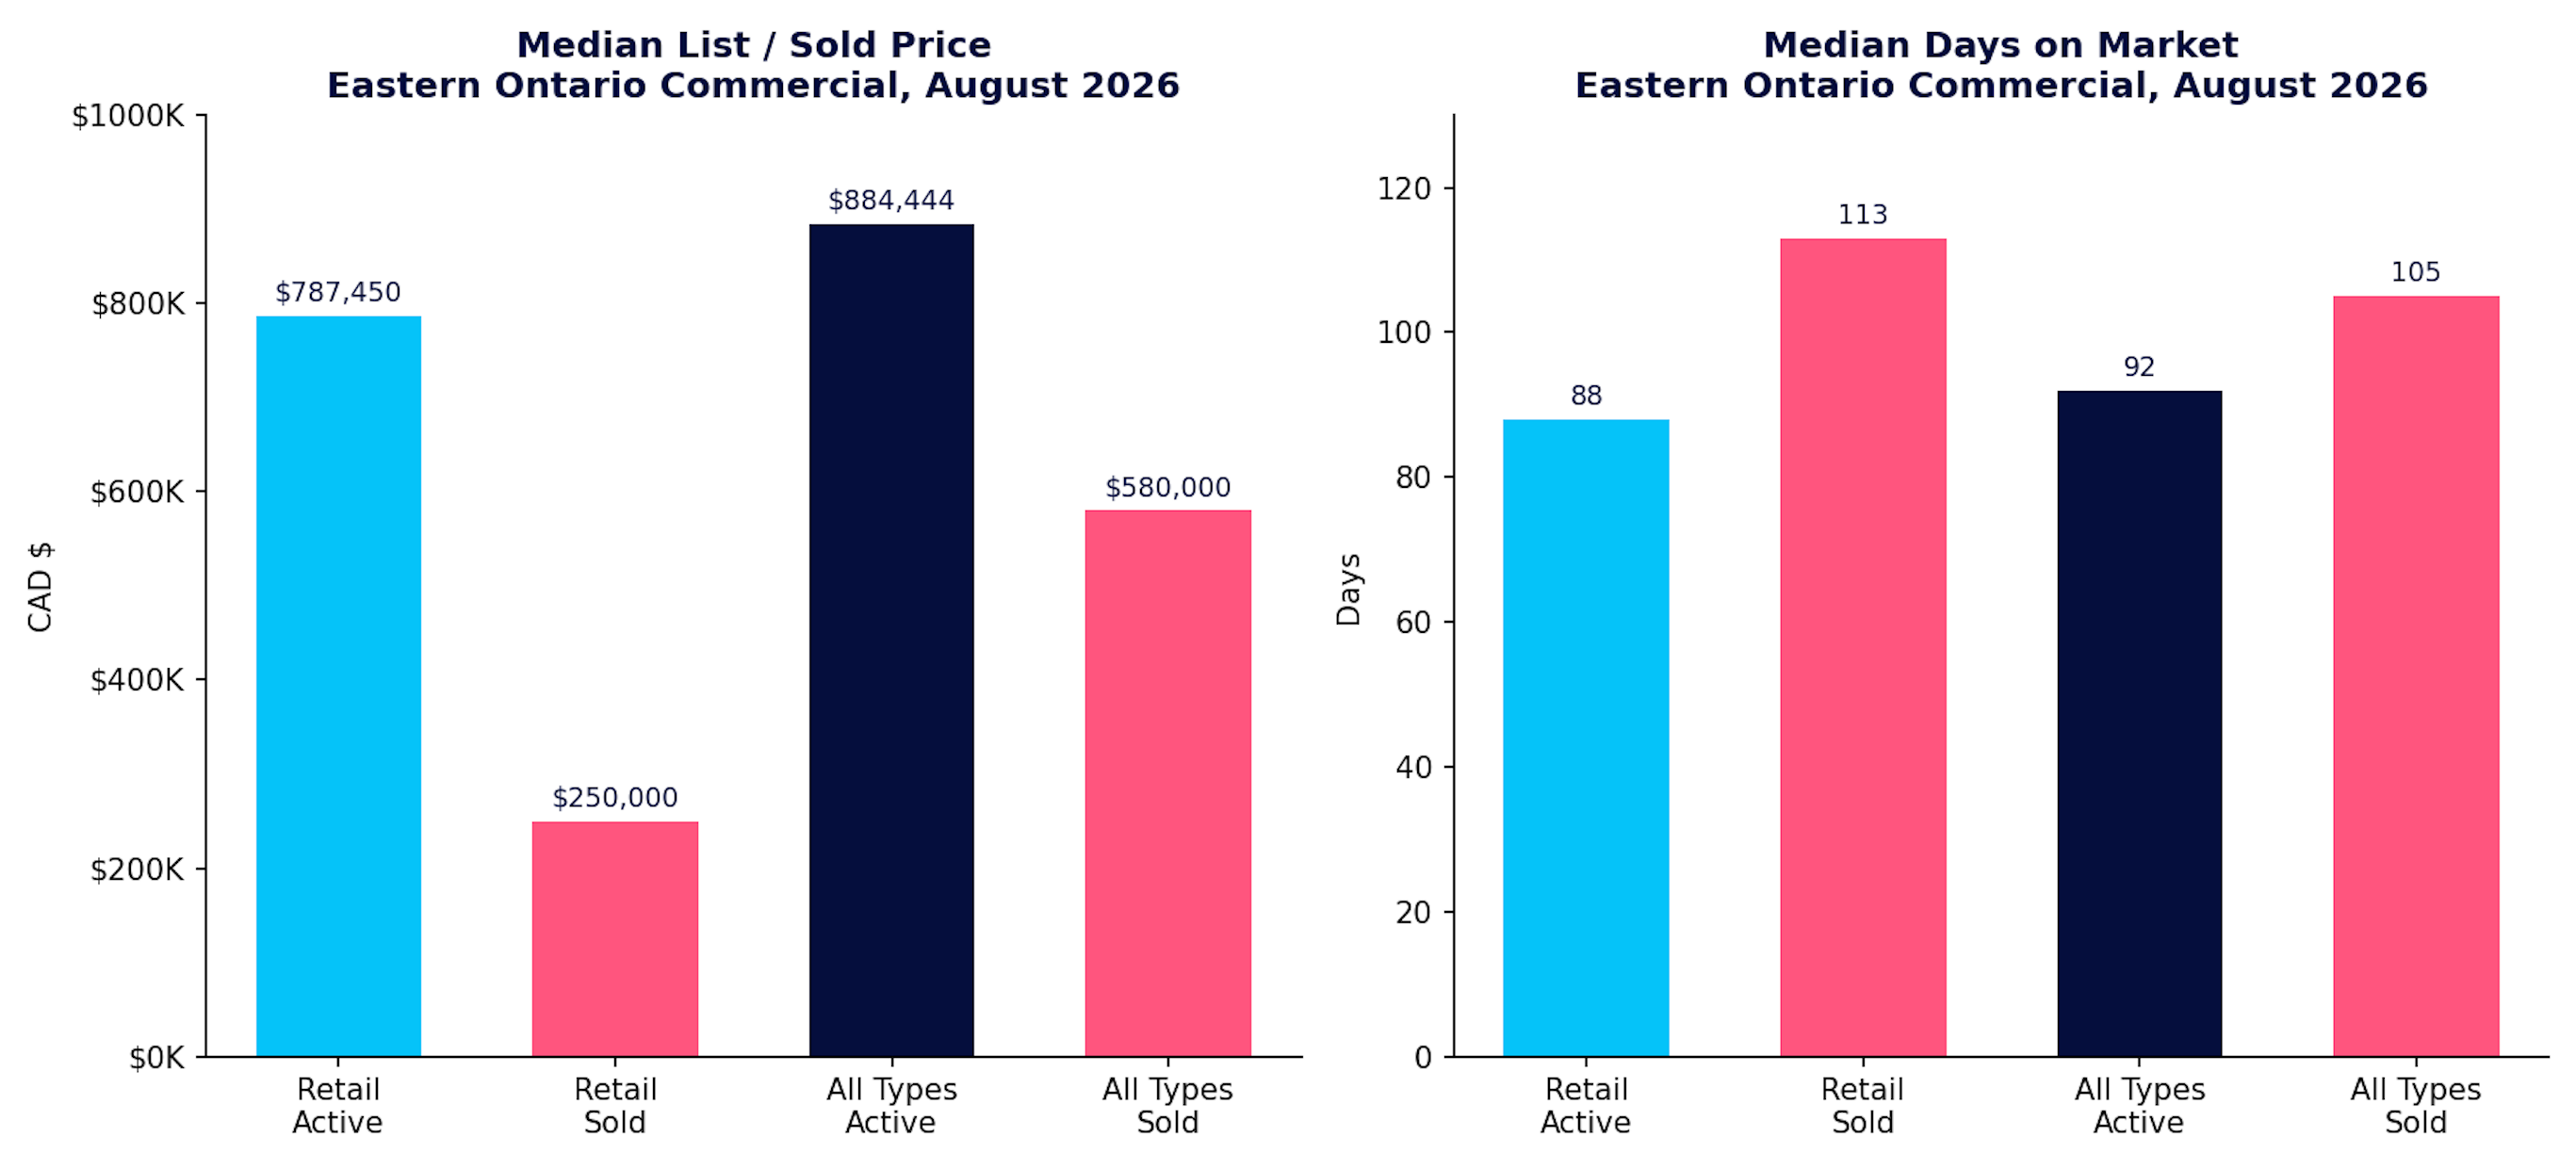
The 27 recent sales closed at a median price of $580,000, compared with a median original list price of $705,000. The median sale-to-list ratio was 89%, confirming that meaningful negotiation has been a normal feature of recent commercial sales.
Median days on market for sold properties was 105 days, or roughly three and a half months from listing to a firm sale. The range was wide: the fastest transaction closed in one day, while the slowest required 621 days, about 20 months.
Sale-to-list ratios ranged from 76% to 115%. At least one property sold above its original asking price, while another closed at roughly three-quarters of its original list price. Property-specific factors, including pricing strategy, condition, location, zoning, income, tenant quality, and urgency, still determine the final result.
What the Active Inventory Reveals
The median asking price across the 112 active commercial listings is $884,444, about $304,444 higher than the median sold price of $580,000, or roughly 52% higher. Part of this gap likely reflects the mix of the active inventory, which may include larger properties, development land, operating businesses, or investment assets not directly comparable to recently sold properties. The size of the gap still signals a potential mismatch between current asking prices and the price points at which buyers have recently transacted.
The median active listing has already accumulated 92 days on market, only 13 days below the 105-day median for properties that successfully sold. When a commercial property approaches the three-month mark without serious activity, sellers should evaluate whether the barrier is price, presentation, condition, incomplete information, permitted use, financing, or a combination of these factors.
What This Means If You Are Selling
In a market with approximately 25 months of inventory, pricing close to supportable market value from the beginning is especially important. Buyers have enough choice to bypass a property that appears significantly more expensive than competing opportunities unless it offers a clear advantage in location, zoning, condition, income, or development potential.
Sellers should focus on completed transactions rather than relying on the asking prices of other active listings. Active listings show the competition, but sold properties show the price and terms buyers have actually accepted.
Information That Can Help a Commercial Listing Compete
- Current zoning and a clear description of permitted uses
- Property tax information and estimated operating expenses
- Building size, lot dimensions, parking, access, and loading details
- Utility capacity, heating systems, hydro service, water, and wastewater arrangements
- Environmental reports or known historical uses, when relevant
- Lease details, rent roll, vacancy, and operating statements for income-producing properties
- Recent improvements, maintenance records, and capital expenditures
- Floor plans, professional photography, drone media, and accurate mapping
- Development, severance, expansion, or adaptive reuse potential, subject to approvals
When Should a Seller Reassess?
- After the initial launch: Review engagement, inquiries, showing activity, and feedback to gauge whether the listing is reaching the intended audience.
- At approximately 60 to 90 days: Compare the property with new competing listings, recent sales, withdrawn listings, and price reductions in the same category.
- Near or beyond 105 days: The property has reached the median exposure period of the recently sold group; evaluate whether current positioning is producing credible buyer interest.
- When market conditions change: Reassess strategy if financing costs, business conditions, inventory, or comparable sales materially shift.
What This Means If You Are Buying or Investing
Current conditions offer more selection and negotiating room than a tighter commercial market would provide. The 89% median sale-to-list ratio shows that recent buyers have regularly secured terms below the seller's original asking position. That said, an asking-price discount does not automatically make a property a good investment. Value depends on income, operating costs, capital requirements, financing, legal use, and exit strategy.
Questions Buyers Should Answer Before Making an Offer
- Is the intended business or development use permitted under current zoning?
- Will a zoning amendment, minor variance, site plan approval, or building permit be required?
- What are the true annual operating costs, including taxes, utilities, insurance, and maintenance?
- Does the property have sufficient hydro capacity, water supply, septic capacity, parking, and access?
- For an income property, are the rents sustainable and are the leases enforceable and transferable?
- How much immediate and future capital investment will the property require?
- Can conventional commercial financing support the purchase, or will alternative terms be required?
Four Numbers to Watch
- Monthly sales pace: An increase above the current ~4.5 sales per month would indicate improving absorption.
- Active inventory: A sustained reduction from 112 listings would gradually reduce buyer choice.
- Sale-to-list ratio: Movement above the current 89% median would suggest seller expectations and buyer offers are narrowing.
- Days on market: A decline from the 105-day sold median would indicate faster decision-making.
The Bottom Line
Rural Eastern Ontario's commercial real estate market currently offers buyers considerable choice, time for due diligence, and demonstrated negotiating leverage. For sellers, the same conditions create more competition and a greater risk of extended market exposure when pricing or positioning does not align with buyer expectations.
Deb Driscoll, Jaime Peca, and Luke Geleynse work with commercial buyers, sellers, and investors throughout rural Eastern Ontario, and can help interpret this data in the context of a specific property and your objectives.
Market statistics are based on listing and sales data reviewed for Leeds and Grenville, Lanark, Frontenac, and Stormont-Dundas-Glengarry. Commercial categories have been combined to illustrate overall regional activity. Because property types, locations, uses, and values vary substantially, these figures should be treated as broad market indicators rather than a valuation of any individual property.
FAQ
Is rural Eastern Ontario's commercial market favoring buyers or sellers?
Buyers currently hold more leverage. With about 25 months of inventory and a median sale-to-list ratio of 89%, buyers have both selection and negotiating room, though well-priced properties still sell.
How long does it take to sell commercial property in rural Eastern Ontario?
Recently sold commercial properties closed in a median of 105 days, though individual results ranged from 1 day to 621 days depending on the property.
Why is the median active price so much higher than the median sold price?
The active inventory likely includes larger properties, land, and investment assets not directly comparable to recently sold properties, but the 52% gap still signals a mismatch between current asking prices and what buyers have recently paid.
Rural Eastern Ontario's commercial market will not stay this favorable for buyers indefinitely. As sales pace picks up or inventory tightens in any of these categories, the negotiating room reflected in today's numbers will start to close. Fill out the form below and Deb Driscoll, Jaime Peca, and Luke Geleynse will walk you through exactly where your target property, business location, or listing stands against these numbers right now.
Check out this article next